MRCPP

Efficient Multi-Robot Coverage Path Planning of Non-Convex Regions of Interests

Minimum-Turn Swaths VG-based Connectivity mTSP Allocation

Authors: <Add authors & affiliations>

Abstract

This letter presents an energy-efficient multi-robot coverage path planning (MRCPP) framework for large, nonconvex Regions of Interest (ROI) containing obstacles and no-fly zones (NFZ). Existing minimum-energy coverage planning algorithms utilize meta-heuristic boustrophedon workspace decomposition. Therefore, even with minimum energy objectives and energy consumption constraints, they cannot achieve optimal energy efficiency. Moreover, most existing frameworks support only a single type of robotic platform. MRCPP overcomes these limitations by: generating globally-informed swath generation, creating parallel sweeping paths with minimal turns, calculating safety buffers to ensure safe turning clearance, using an efficient mTSP solver to balance workloads and minimize mission time, and connecting disjoint segments via a modified visibility graph that tracks heading angles while maintaining transitions within safe regions. The efficacy of the proposed MRCPP framework is demonstrated through real-world experiments involving autonomous aerial vehicles (AAVs) and autonomous surface vehicles (ASVs). Evaluations demonstrate that the proposed MRCPP consistently outperforms state-of-the-art planners, reducing average total energy consumption by 3% to 40% for a team of 3 robots and computation time by an order of magnitude, while maintaining balanced workload distribution and strong scalability across increasing fleet sizes. The MRCPP framework is released as an open-source package and videos of real-world and simulated experiments are available at https://mrc-pp.github.io/.

Overview & Contributions

MRCPP integrates analytic geometry, graph-based connectivity, and optimization-based allocation to produce efficient coverage paths for non-convex ROIs with obstacles and no-fly zones.

Key Ideas

  • Minimum-area sweep orientation: rotating calipers compute the minimum-area enclosing rectangle to set a globally consistent sweep direction.
  • Minimum-turn swath generation: parallel swaths aligned with the sweep direction, clipped to the ROI, ordered along the minor axis.
  • Headland buffers: buffering the ROI boundary and exclusion zones yields a safe operable region for turns.
  • VG connectivity: a visibility graph connects disjoint swaths with collision-free transitions.
  • Workload-balanced allocation: a modified mTSP assigns swaths to minimize the maximum robot path length.
Rotating Calipers Headland Buffering Visibility Graph mTSP (LKH)

MRCPP Pipeline

MRCPP follows a geometry-to-optimization workflow: (i) compute a global sweep orientation, (ii) generate parallel swaths in the buffered free space, (iii) connect disjoint swaths using VG-based transitions, and (iv) allocate swaths to robots via a workload-balanced mTSP formulation.

MRCPP pipeline: ROI and exclusion zones, headlands, swaths, and allocation.
Fig. 1. MRCPP pipeline: ROI with exclusion zones, headland-buffered operable region, parallel swath decomposition, VG-based connectivity for feasible transitions, and multi-robot allocation via mTSP.

Benchmark Results

We evaluate MRCPP on seven benchmark environments: Cape, Complex-12, Complex-22, Wetland, Island, Rect, and Simple. These range from simple convex regions to large non-convex ROIs with internal no-fly zones (Complex-12, Complex-22, Wetland). Performance is reported in terms of computation time, path length, and energy consumption. Scalability is further assessed by increasing fleet size in the Complex-22 and Cape environments.

Benchmark environments and MRCPP coverage paths.
Fig. 2. Representative benchmark environments with MRCPP-generated coverage paths for three AAVs (yellow, violet, blue). No-fly zones are shown as shaded red polygons.

Table I. Three-AAV Comparison Across Environments

Metrics: computation time, total fleet energy including depot round-trips (Et [Wh]), resulting path length ( [km]), coverage-only fleet energy (Ēt [Wh]), and coverage-only path length (ℓ̄ [km]). Best value per scenario highlighted in bold. A dash (—) indicates no valid solution.

Scenario MRCPP (Ours) EAMCMP DARP+MST POPCORN+SALT
Time [s] Et Ēt ℓ̄ Time [s] Et Ēt ℓ̄ Time [s] Et Ēt ℓ̄ Time [s] Et Ēt ℓ̄
Cape 1.28586.3736.68470.0829.28 4.93601.6835.66496.5628.90 33.82600.8534.92503.9828.68 55.87818.9939.16708.1832.06
Complex-12 3.60478.1427.40455.7426.12 45.31482.2324.73479.5824.62
Complex-22 1.23256.9214.49241.5513.66 1.25419.6923.55404.9522.67 18.22270.7513.69265.8813.46
Wetland 2.10293.5217.06274.1715.82 0.52309.6717.23285.9315.78 44.39325.1015.61309.9314.68
Island 0.4737.821.6029.771.25 0.5336.801.6030.251.29 5.2137.611.3733.851.18
Rect 0.4468.213.6655.162.99 0.0285.254.3573.833.75 4.7589.183.8187.373.74 20.71137.063.99131.993.75
Simple 0.63117.906.67104.465.97 0.02185.0910.41169.569.57 5.70140.256.33138.146.26 32.28242.597.18235.476.83

Table II. Scalability in the Complex & Cape Environments (4–10 AAVs)

Metrics: computation time (tc [s]), total fleet energy including depot round-trips (Et [Wh]), and total coverage path length ( [km]). A dash (—) indicates no valid solution. Bold marks the best value per row.

Scenario MRCPP (Ours) EAMCMP
tc Et tc Et
Complex (4 AAVs) 1.41294.4016.40 1.45303.2816.83
Complex (6 AAVs) 1.81291.2816.56 1.67311.8017.36
Complex (8 AAVs) 2.51316.9517.94 1.89321.9018.39
Complex (10 AAVs) 2.90334.7418.91
Cape (4 AAVs) 1.96684.6343.06 479.20783.1447.64
Cape (6 AAVs) 2.50711.8844.71
Cape (8 AAVs) 3.15809.3750.95
Cape (10 AAVs) 3.70923.4758.28
Scalability results for MRCPP vs baselines as number of robots increases.
Fig. 3. Scalability in fixed NFZ-constrained environments with varying fleet sizes (4–10 AAVs). MRCPP scales gracefully across all configurations; EAMCMP fails for larger fleets in the Cape environment.

EAMCMP Baseline Comparison

EAMCMP relies on boustrophedon decomposition without explicit sweep orientation optimization, resulting in suboptimal turn sequences and higher energy consumption across most benchmark environments. MRCPP outperforms EAMCMP in both total fleet energy (E_t) and coverage-only energy (Ē_t) in six of seven scenarios — the exception being Island, where EAMCMP achieves a marginally lower E_t (36.80 Wh vs. 37.82 Wh) due to its sensitivity to initial vehicle positions. Furthermore, EAMCMP fails to produce a valid solution in the Complex-12 environment, whereas MRCPP successfully solves all seven scenarios.

EAMCMP Cape
Cape (EAMCMP)
EAMCMP Complex
Complex (EAMCMP)
EAMCMP Rectangle
Rectangle (EAMCMP)
EAMCMP Island
Island (EAMCMP)
EAMCMP Simple
Simple (EAMCMP)

Ablation Study

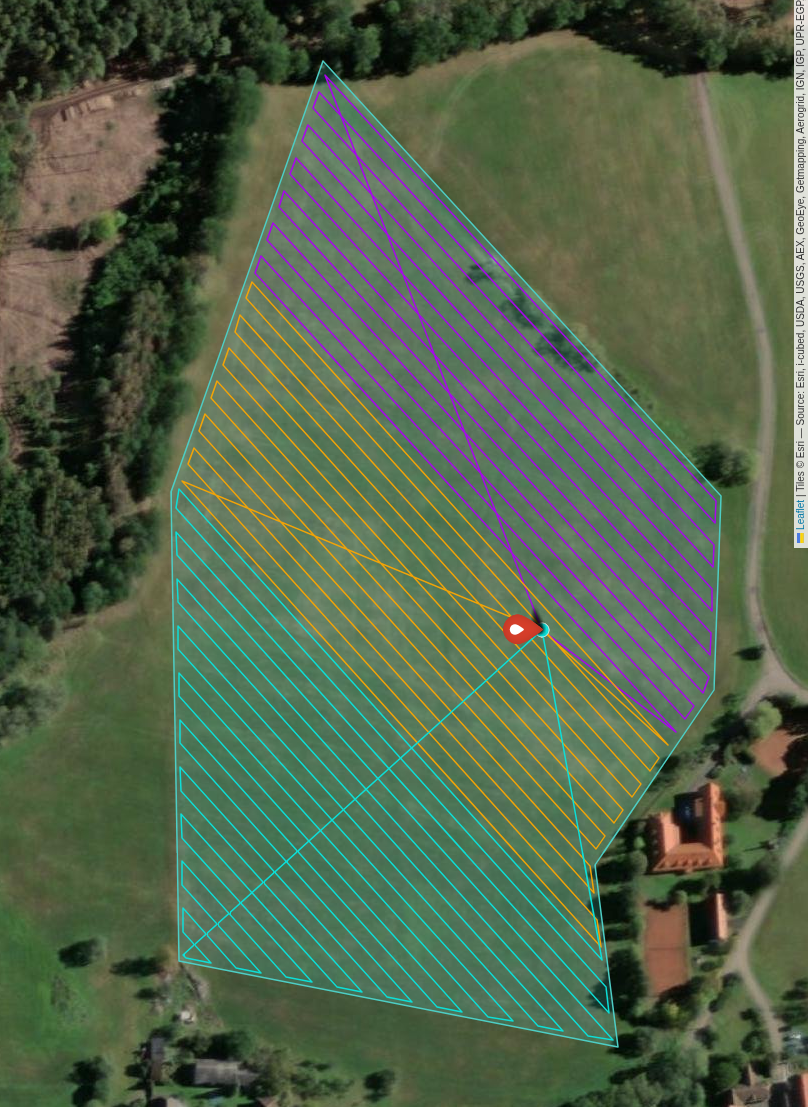
We evaluate four sweep orientation strategies and assess the sensitivity of the buffer parameter, then compare MRCPP and EAMCMP head-to-head in an obstacle-rich environment across different fleet sizes.

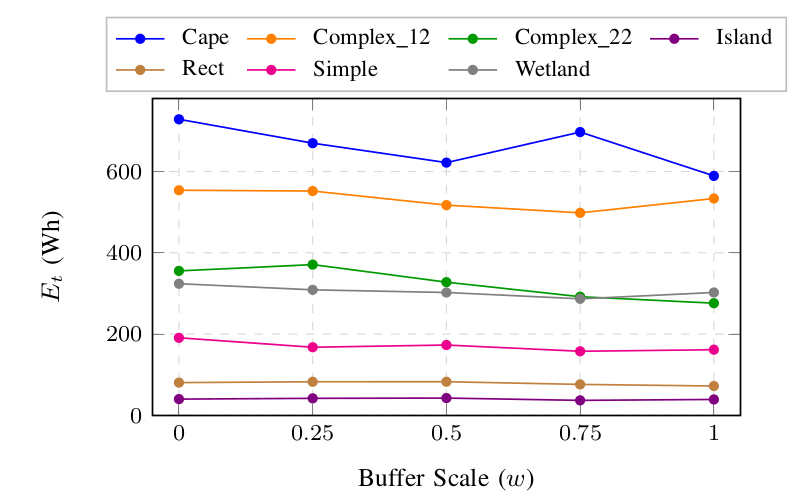
Table III. Orientation Ablation — Fleet Energy Across Scenarios

Four sweep orientation strategies evaluated across seven benchmark scenarios. Metrics: total fleet energy including depot round-trips (Et [Wh]) and coverage-only fleet energy (Ēt [Wh]). Bold marks the lowest Et per scenario.

Scenario MAR Angle Search PCA Min-Width
EtĒt EtĒt EtĒt EtĒt
Cape 589.21464.64 662.84537.14 586.37470.08 652.80540.78
Complex-12 533.65506.20 486.15457.19 507.58470.05 478.14455.74
Complex-22 275.91253.37 278.34260.82 256.92241.55 276.91257.23
Island 39.0032.43 40.6733.13 39.6031.57 37.8229.77
Rect 72.0959.45 72.7661.70 74.7162.27 68.2155.16
Simple 161.45143.66 119.85104.45 117.90104.46 123.98108.65
Wetland 161.45143.66 119.85104.45 117.90104.46 123.98108.65

Min-Width achieves the lowest Et in three of seven scenarios (Complex-12, Island, Rect), while PCA is best in three others (Cape, Complex-22, Simple). MAR and Angle Search are never the top performers. The spread between best and worst orientation can exceed 35% (Simple), confirming sweep direction is a significant design parameter.


Effect of Headland Buffer on Energy Consumption

Effect of buffer scale w on total fleet energy consumption across environments.
Fig. 4. Effect of headland buffer scale w on total fleet energy consumption Et across different environments. Lower values indicate better energy efficiency. Non-convex environments (e.g., Complex-12, Cape) show greater sensitivity to the buffer parameter than simpler ones (Island, Rect, Simple, Wetland).

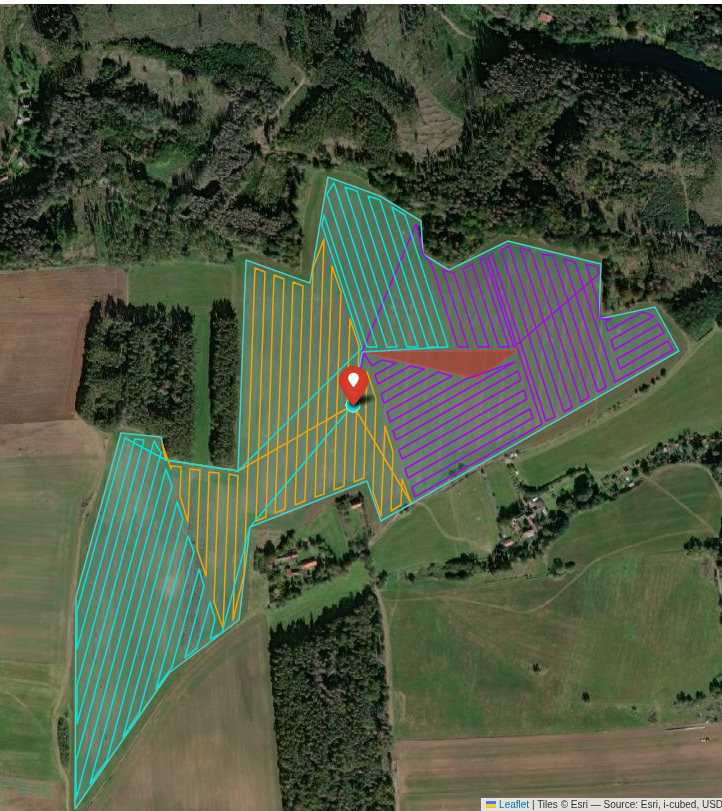
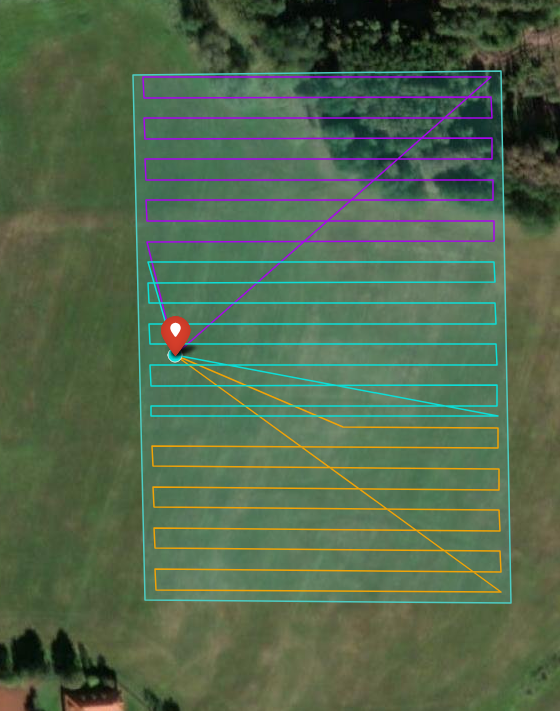
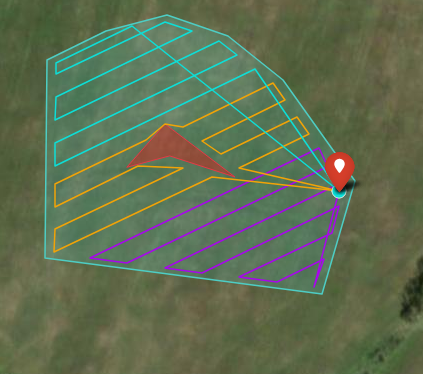
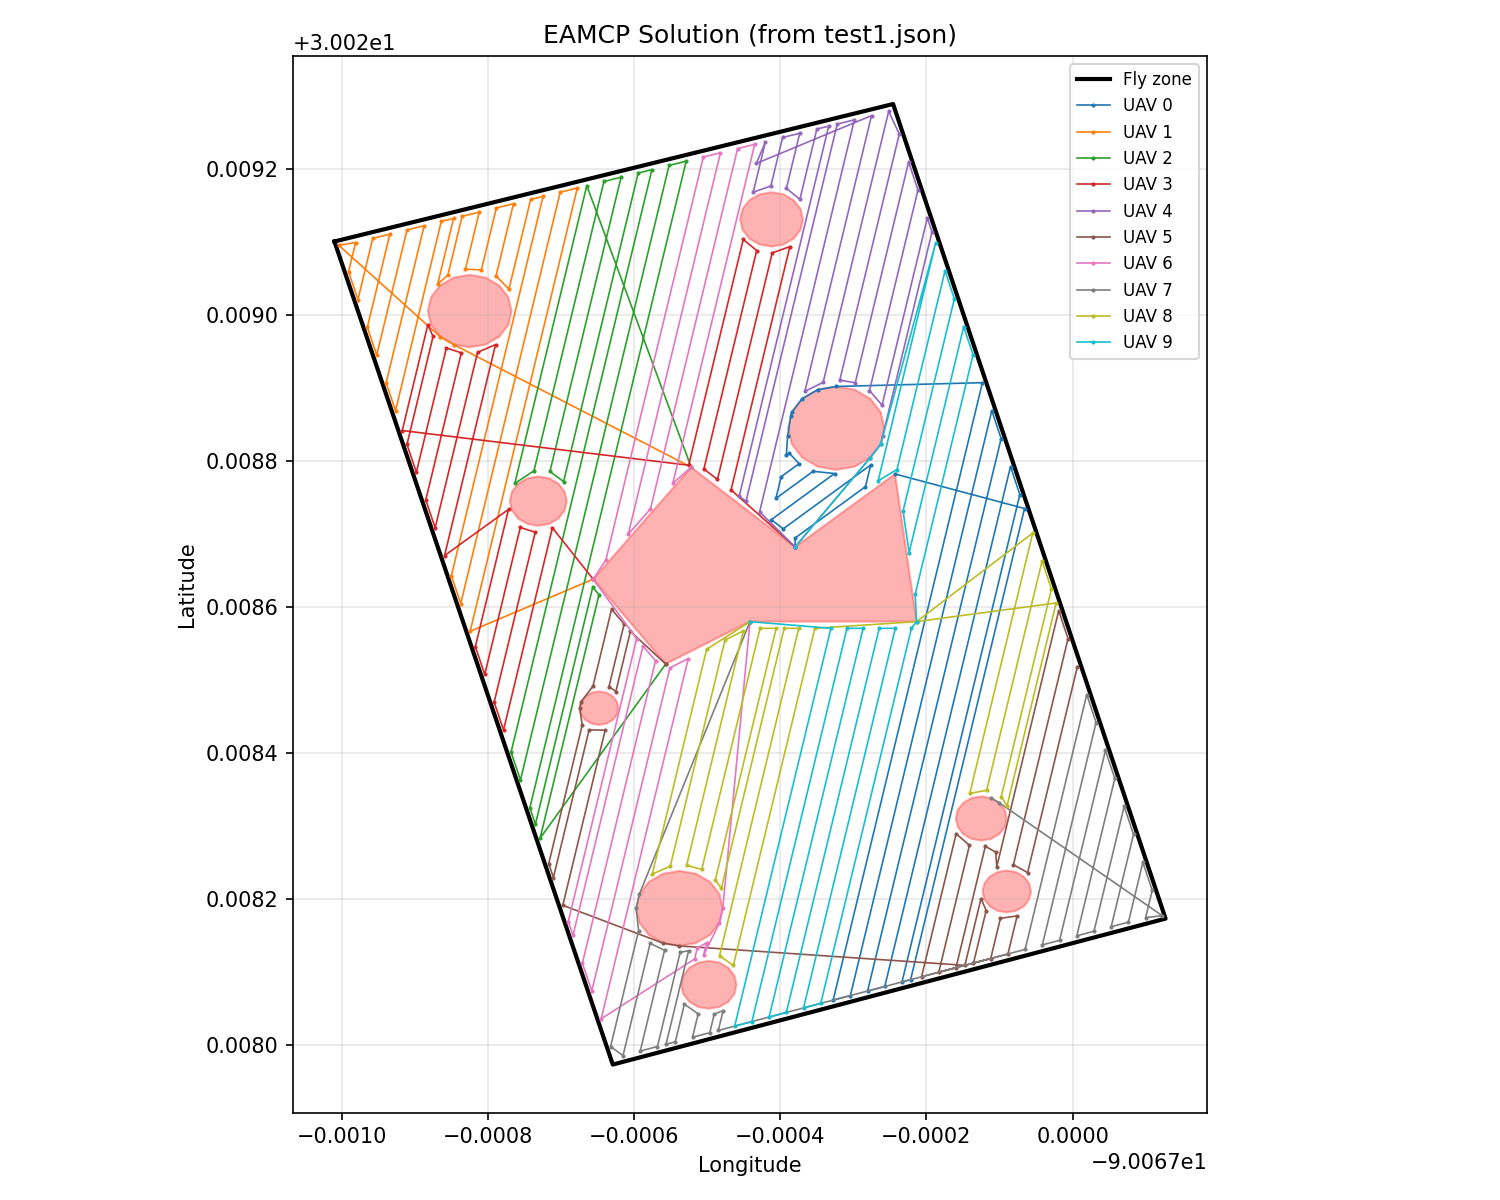
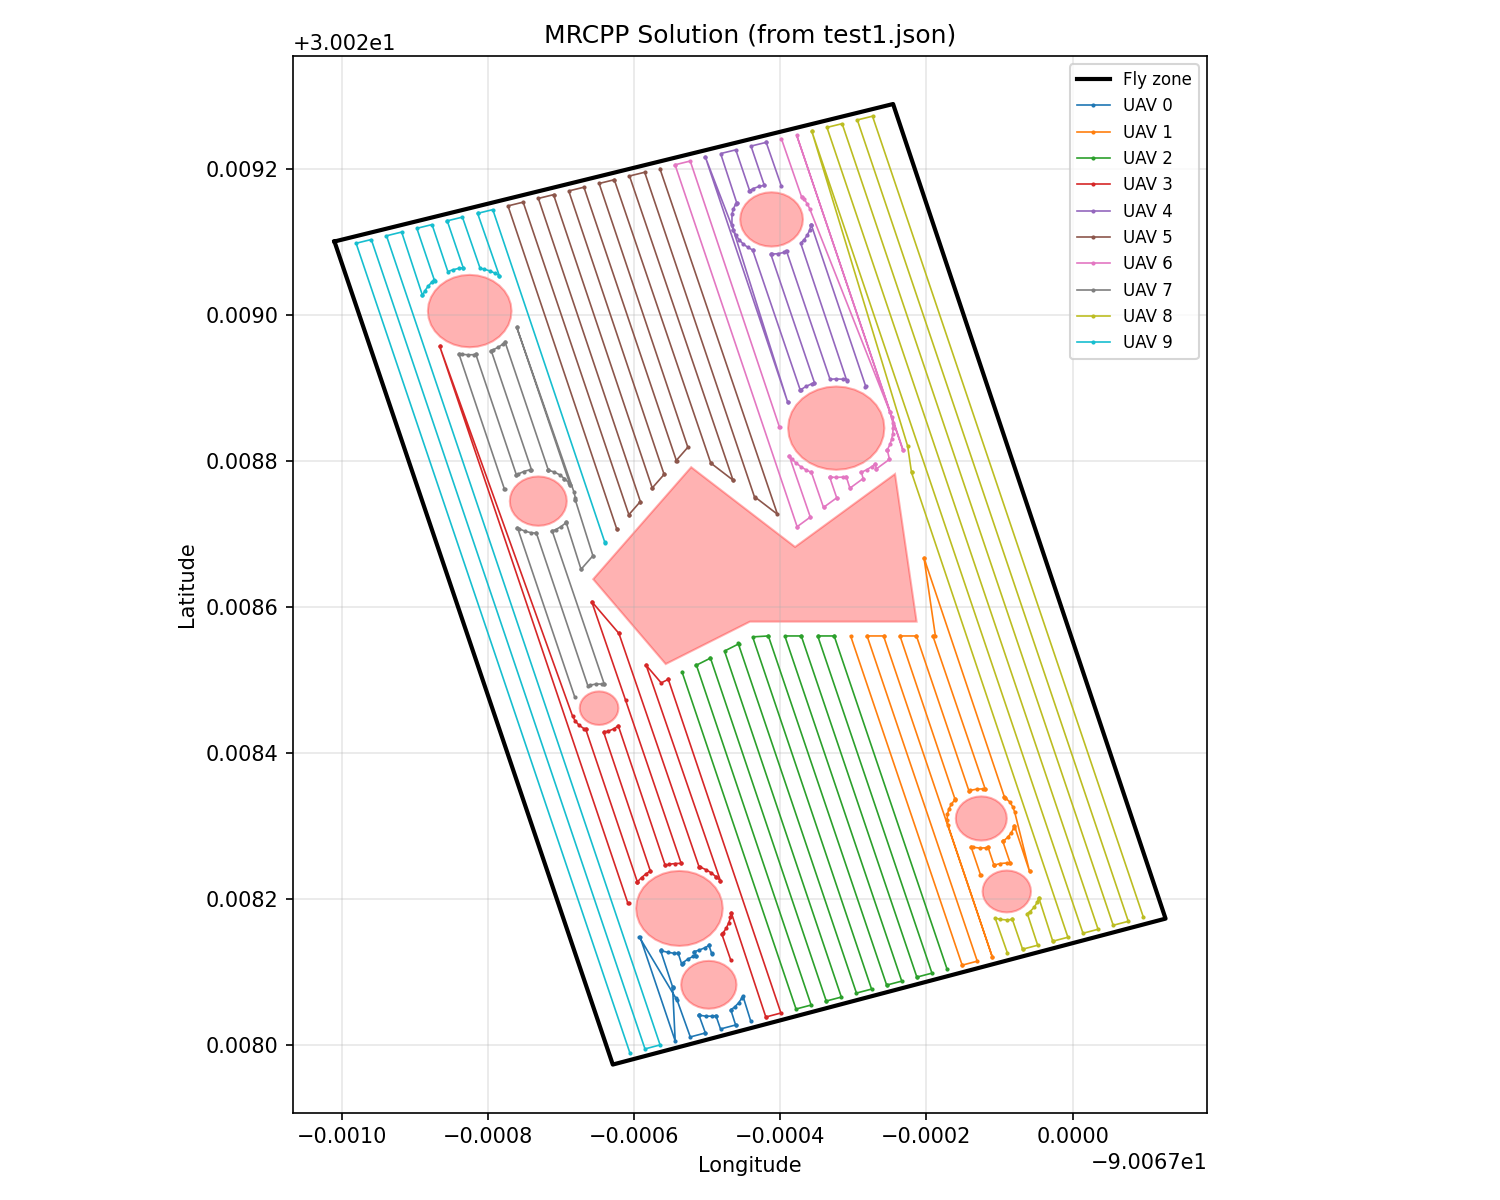
Table IV. MRCPP vs EAMCMP — Obstacle-Rich Environment (3 / 6 / 10 AAVs)

Performance comparison in an environment with 10 convex and non-convex obstacles. Metrics: worst-case per-robot energy (Eomax [Wh]), total fleet coverage-only energy (Ēt [Wh]), and computation time (Tc [s]). Bold indicates the best value per fleet size.

# Robots Method Eomax [Wh] Ēt [Wh] Tc [s]
3 MRCPP (Ours) 41.81 111.17 9.65
EAMCMP 44.49 132.25 68.87
6 MRCPP (Ours) 21.81 104.58 3.22
EAMCMP 23.11 135.51 58.06
10 MRCPP (Ours) 13.92 96.73 3.11
EAMCMP 14.73 139.77 68.95

MRCPP is roughly 12× faster on average (5.33 s vs 65.29 s). Its total fleet energy decreases by ~13% as the fleet grows from 3 to 10 AAVs, reflecting effective workload distribution. EAMCMP's energy increases by ~5.7% over the same range due to sensitivity to initial positions rather than geometric structure.

EAMCMP coverage paths with 10 convex and non-convex obstacles.
Fig. 5a. EAMCMP — 10 AAVs, 10 obstacles. Paths occasionally violate NFZ and obstacle constraints near hazards.
MRCPP coverage paths with 10 convex and non-convex obstacles.
Fig. 5b. MRCPP — 10 AAVs, 10 obstacles. Buffer-zone constraints and VG detouring enforce strict separation from all boundaries.

Real-World Field Experiments

We validate MRCPP with two real-world deployments: (i) aerial coverage using two DJI Mavic Air AAVs (paths uploaded and executed via Litchi), and (ii) aquatic coverage using two ASVs equipped with YSI EXO2 sondes for in situ sensing. The executed coverage paths and the no-fly zone are visualized in the experiment interface and overlaid on satellite imagery.

AAV coverage experiment with two DJI Mavic Air.
Fig. 4a. AAV coverage experiment: the ROI (white polygon) is covered by two DJI Mavic Air AAVs with paths shown in orange and blue; the no-fly zone is highlighted in red.
ASV coverage experiment with two surface vehicles.
Fig. 4b. ASV coverage experiment: two ASVs execute coverage paths shown in red and green and obstacles (yellow) over satellite imagery of an aquatic environment.

Videos

Note: For best viewing quality, please watch the videos in full-screen mode.

AAV Experiment

Description (Fig. 1a): Two DJI Mavic Air AAVs execute MRCPP-generated coverage paths over a polygonal Region of Interest (ROI). The planned trajectories (orange and blue) are uploaded to the Litchi mission-planning software and flown concurrently. The circular red region denotes a no-fly zone enforced during path generation.

Tip: Click the icon in the video player to view in full screen.

ASV Experiment

Description (Fig. 1b): Two autonomous surface vehicles (ASVs), each equipped with YSI EXO2 sondes, execute MRCPP-planned coverage paths in a coastal aquatic environment. The executed trajectories (red and green) and obstacle (yellow) are overlaid on satellite imagery, enabling real-time monitoring and verification of coverage performance.

Tip: Full-screen playback is recommended for improved spatial clarity.

BibTeX

@article{mrcpp2025,
  title   = {Efficient Multi-Robot Coverage Path Planning of Non-Convex Regions of Interests},
  author  = {<authors>},
  journal = {},
  year    = {2025},
  url     = {https://mrc-pp.github.io/}
}

Acknowledgments